

Source
Industries that are killing the river
In the Hindon region, the main types of industries include textile and Dyeing units, Sugarcane and Agro-based industries, Paper and Pulp mills and Chemical and Pharmaceutical factories.
Menu
0%
How did Hindon die ?
Chapter 1
As a result of river exploitation, humans adapted exploitative development and patterns of river usage significantly changed.

Scroll Down
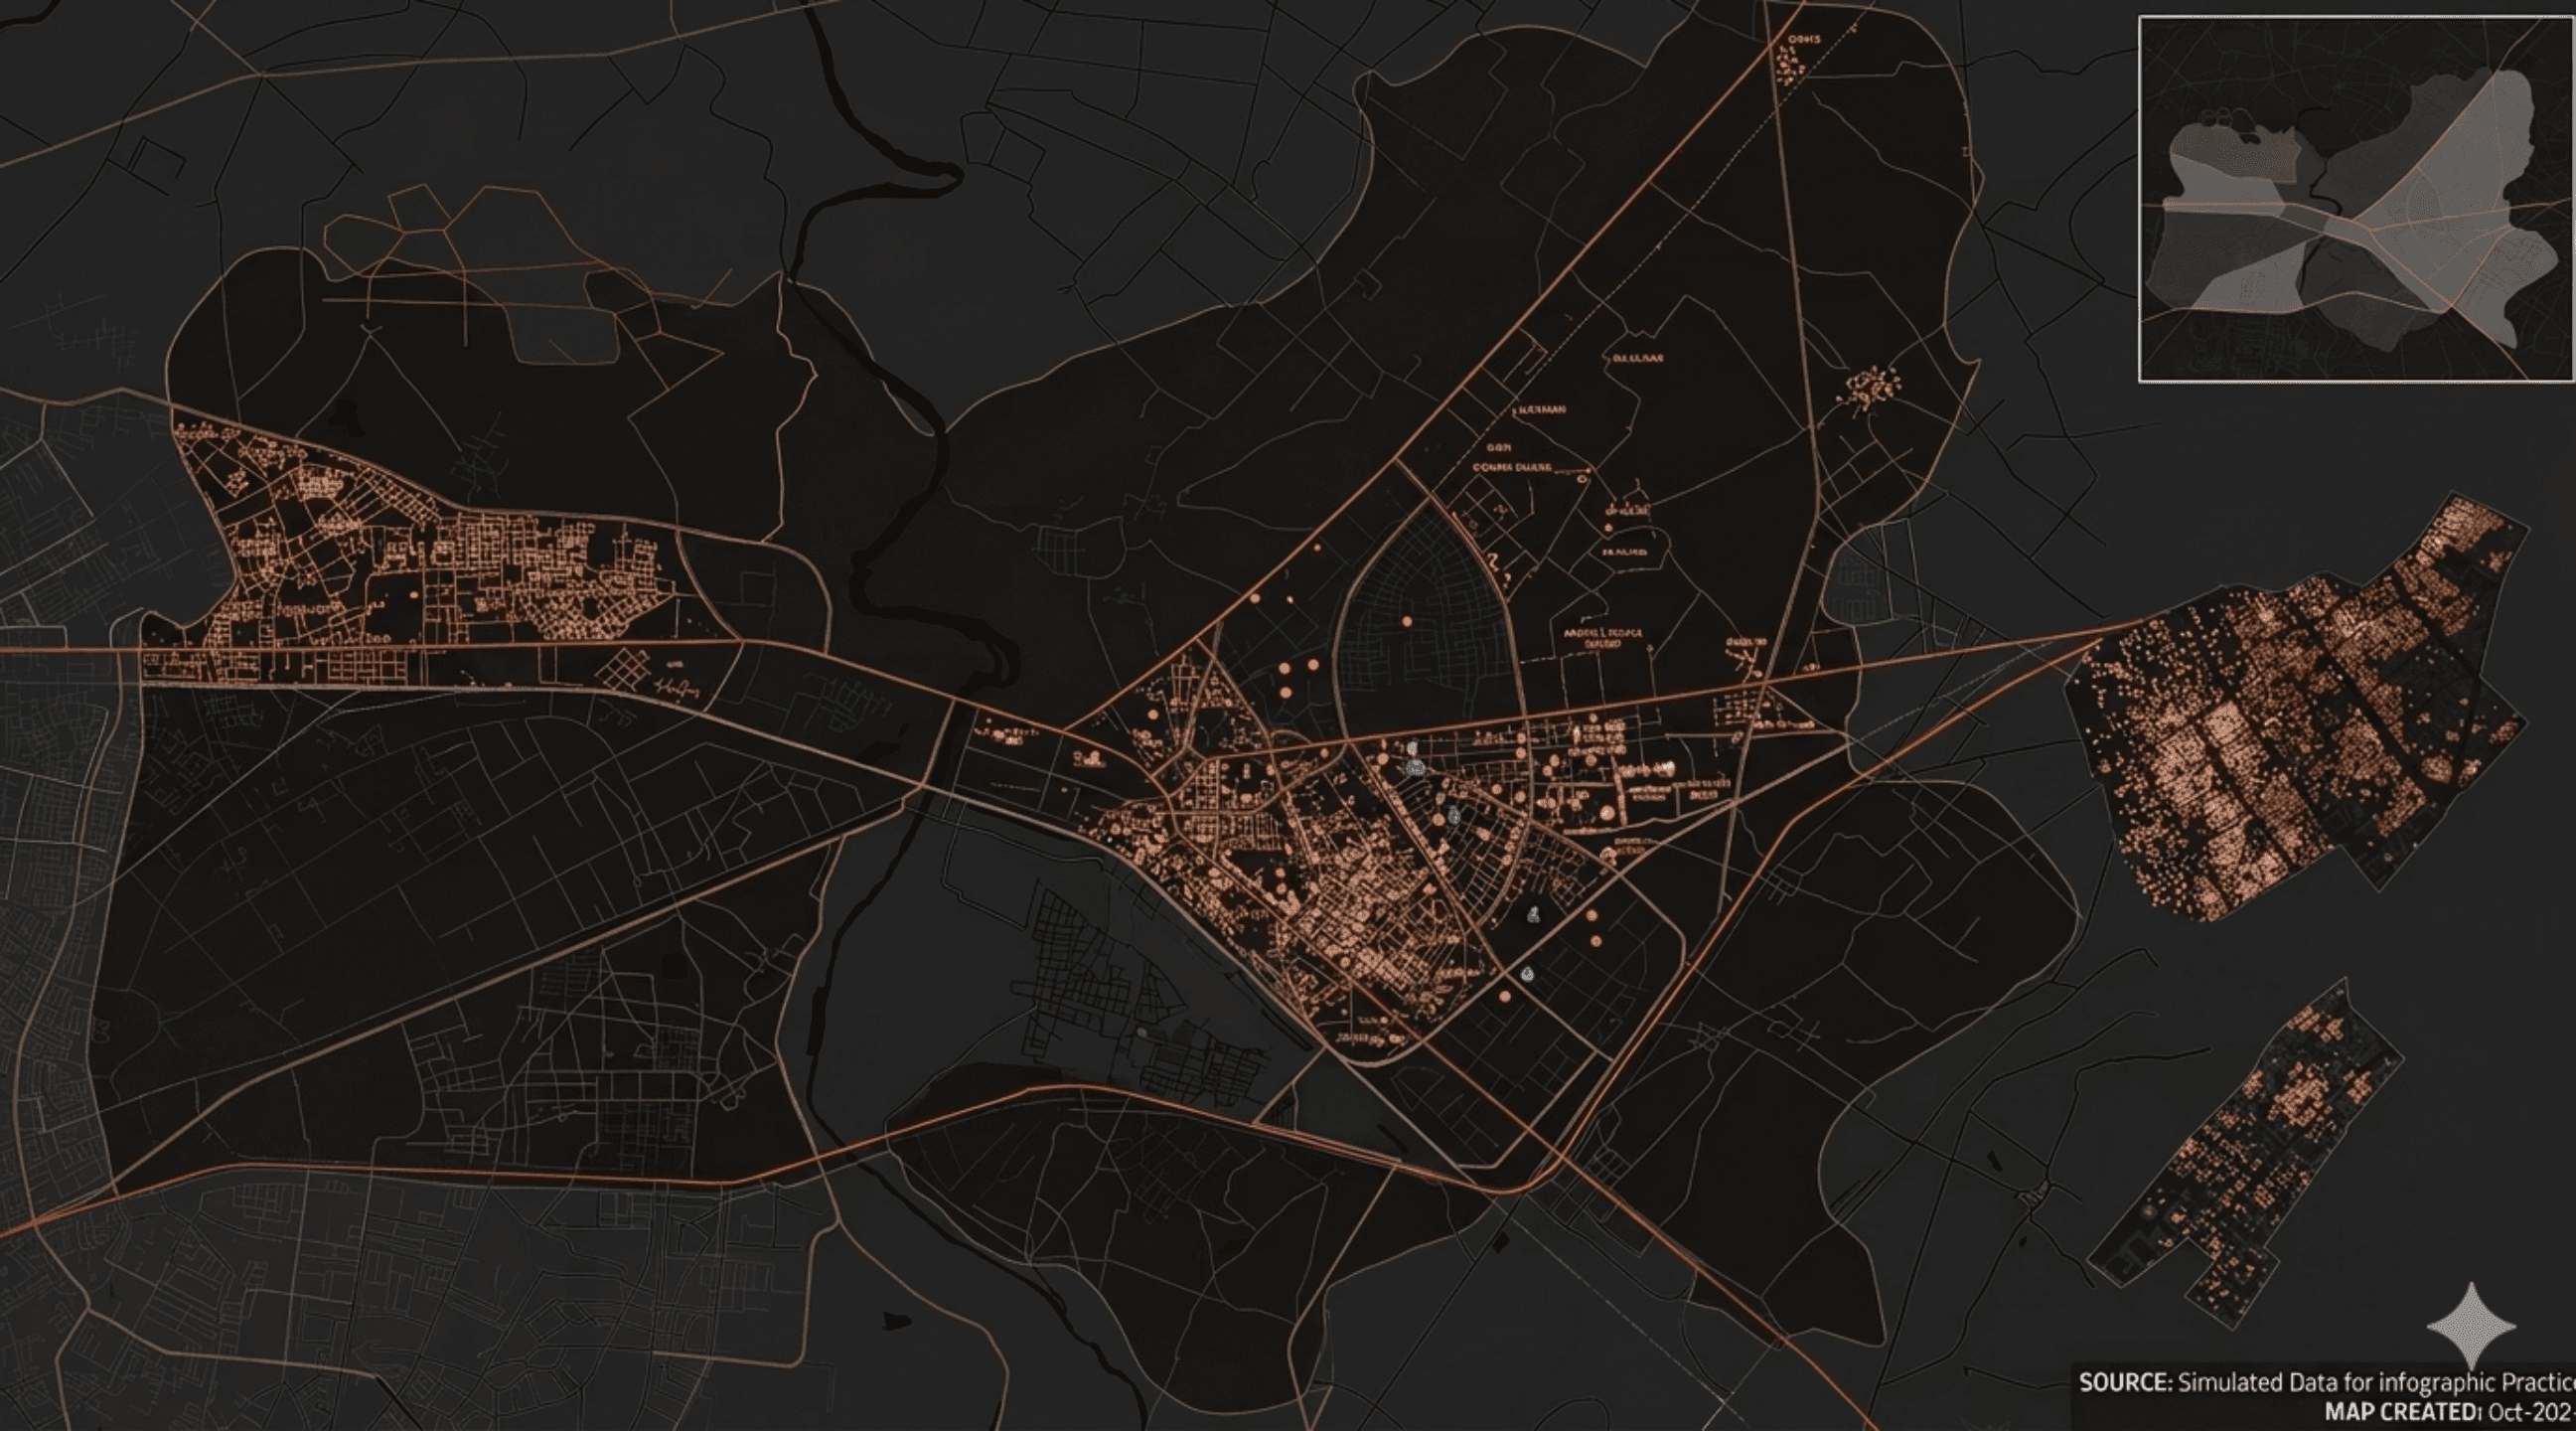


Ghaziabad, Uttar Pradesh ( Down Stream )
Urban Exapansion
near Hindon River
Reduced Forest
Urban Exapansion
in Ghaziabad
Nandgram
City Forest
Rajnagar
Hindon Airport
Sahibabad
Indrapuram
Dasna
Industrial area
The downstream region under urban pressure
As development rapidly grew in downstream Ghaziabad, it brought economic growth and revenue, encouraging both government authorities and private investors to expand development further towards Noida and Greater Noida.
Over time, this rapid industrial and urban growth transformed land into urban spaces, increasing pressure on the river through industrial waste.

"Hindon river is receiving over 72,170 kilolitres per day (KLD) of industrial effluents from 357 industries and 943 million litres per day (MLD) of domestic sewage, with more than 220 MLD remaining untreated due to insufficient infrastructure"
The industrial growth chemical lead to "River Death"
Source : Times of India
Source
Number and Types of Industries
Agro Based Units
Bricks Kilns Units
Electroplating Units
Pharma Units
3000–6000 units
2000–4000 units
4000–8000 units
800–1500 units
Chemical Units
Textile Units
1200–2500 units
1500–3000 units
How are these industrial chemicals slowly poisoning the river and breaking its ability to sustain life?
When industrial chemicals mix with river water, they react by reducing dissolved oxygen and changing the water’s pH level. Organic waste decomposes and produces harmful gases like ammonia and methane, while heavy metals such as chromium and lead dissolve into the water and poison fish, plants, and groundwater.
pH level
Middle Stream
Low Stream
Upper Stream
Source
Development happened in various ways and lead to taking away the land of agriculture, barren land and other available land along withe the flood plain.
Here is detailed data showing how land use has changed over the years 2000, 2008, 2016, and 2026.
When concrete began replacing nature

Mostly rural landscape with agriculture dominating and very limited urban development.
Year : 2000
Next
Build Up Area
Other Areas
2000
2016
2008
2026
With these huge developments, waste water Increased without proper underground sewage treatments.
and due to whixh groundwater in the Hindon River Basin is heavily contaminated, especially with nitrates and dissolved pollutants and these are not visible. Also large number of people in the basin still use it as they don’t have alternantive.
What all changed with the Growth ?

- - - - - - -- - -- - - - --
- - - - -
- -
- - - - -
- - - - -
- - - - - - - - - - - - - - - -
- - - - - - - - - - - - - - - - - - - - - - - - - - - - - - - - - - - - - --
- - - - - - - - - - - - - - - - - - - - - - - - - - - - - - - -
- - - - - - - - - - - - - - - - - - - - - - - - - - - - - - - - - - - - - - - - - - -
Where did we go wrong ?
With these huge developments, waste water increased without proper underground sewage treatments made from households and illegal activities by industrial owners.
It's the result of poor planning and improper waste management by the government

Understanding the Effect
These impacts directly affect river ecology by degrading water quality, disrupting natural flow patterns, reducing biodiversity, and weakening the river’s ability to sustain life and also humans social use of the river decreases.
What is lost when the river is disrupted?
@Hindon River Project 2026


@MDes Dau 2026 Final Thesis Project 2026
Connect to help
Can we restore it back?
What died with Hindon ?
How did Hindon die?
Home Page
Location


Total 68 health checkups were done by NGT in Uttar Pradesh and out of 7,520 people (1.6 per cent) found having cancer in Meerut, Saharanpur, Shamli, Muzaffarnagar and Baghpat
First industries emerge in the Hindon basin
-- -- - - - - - - - - - - - - - - - -
Since years, NGT has been monitoring Hindon’s pollution caused by these industries
Timeline of gradual river pollution over the years
- - - - - -- - - - - -- - -
2024
2023
2019
2020
2021
2022
2018
2017
2015
2014
2007
1970s
1980s
1950s
1900s - 2024
Source
Source
Source
Organic waste in the Hindon River mainly comes from untreated sewage, livestock waste, agricultural runoff, and food waste through drains and settlements.
This Continuous discharge of organic waste contributes to foul odors, algal growth, water quality deterioration, and the gradual transformation of the Hindon into a dead river.
What are these organic waste sources
Is it really only about industrial waste?
The river’s decline is caused not only by chemicals, but also by increasing land build-up, waste dumping, and unplanned development along its banks that put pressure on the ecosystem without productive use.
No, it runs much deeper than that, affecting everything around us.
While industrial discharge is a major cause of pollution in the Hindon, it is not the only one. Large volumes of untreated sewage, household wastewater, agricultural runoff, animal waste, and decaying organic matter enter the river every day through drains and tributaries.
Is there any other source of this waste?
Yes. Organic waste